

Introduction:
In the dynamic and ever-evolving landscape of cloud computing, ensuring the health and performance of your AWS (Amazon Web Services) infrastructure is crucial. AWS CloudWatch provides a robust monitoring and alerting solution, allowing you to gain insights into your resources' behaviour and receive timely notifications when something goes awry. In this blog post, we'll delve into the world of CloudWatch, exploring its monitoring capabilities and the art of creating effective alarms.
Understanding Amazon CloudWatch:
1. Unified Monitoring:
CloudWatch offers a unified platform for monitoring various AWS resources, applications, and custom metrics. It collects and tracks key performance indicators, providing a centralized view of your entire AWS environment.
2. Metrics and Logs:
CloudWatch allows users to collect, store, and retrieve metrics, as well as monitor and troubleshoot log files. This combination of metrics and logs provides a holistic view, helping to identify and resolve issues efficiently.
3. Custom Metrics:
Tailoring monitoring to specific business needs is made possible through custom metrics. Organizations can define and publish their own metrics, enabling a more granular and business-specific approach to monitoring.
Leveraging CloudWatch Alarms:
1. Setting Up Alarms:
Alarms in CloudWatch are a powerful tool for receiving notifications or taking automated actions based on defined thresholds. Users can set up alarms for specific metrics, such as CPU utilization or network latency, to be alerted when these metrics breach predefined limits.
2. Proactive Monitoring:
Alarms enable proactive monitoring by notifying administrators of potential issues before they impact end-users. This proactive approach is critical for maintaining a high level of service availability and minimizing downtime.
3. Automated Responses:
CloudWatch alarms can be configured to trigger automated responses, such as scaling resources up or down based on demand. This automation ensures that the infrastructure adapts dynamically to changing workloads.
4. Notification Integrations:
CloudWatch integrates seamlessly with other AWS services, allowing users to set up notifications through services like Amazon SNS (Simple Notification Service) or AWS Lambda. This flexibility enables organizations to tailor their alerting mechanisms to their specific workflow and communication preferences.
Creating Effective CloudWatch Alarms:
Step 1: Define Your Objectives
Before diving into the CloudWatch console, clearly define what you want to monitor and which metrics are critical for your applications or services. This step is crucial for setting up alarms that align with your business objectives.
Step 2: Navigate to the CloudWatch Console
Access the CloudWatch console through the AWS Management Console. Here, you can explore various tabs, including Dashboards, Alarms, Metrics, and Logs.
Step 3: Choose Metrics and Set Thresholds
Identify the relevant metrics for your resources and set thresholds that indicate normal behavior. For instance, you might want to create an alarm for high CPU usage, low disk space, or increased latency.
Step 4: Configure Actions
When a threshold is breached, CloudWatch can perform specific actions, such as sending notifications, triggering an AWS Lambda function, or stopping an EC2 instance. Configure these actions based on the severity of the alarm.
Step 5: Test Your Alarms
Once configured, it's essential to test your alarms to ensure they trigger when expected. This helps validate the effectiveness of your alerting strategy and ensures a rapid response to potential issues
Best Practices for CloudWatch Monitoring and Alarming:
1. Establishing Baselines:
Understanding the normal behavior of your system is essential. Establish baselines for key metrics to differentiate between regular fluctuations and potential issues.
2. Fine-Tuning Thresholds:
Set appropriate thresholds for alarms based on your application's requirements. Fine-tune these thresholds over time to reflect changes in workload patterns.
3. Collaborative Alerting:
Involve relevant stakeholders in the alerting process. Ensure that alerts are communicated to the right teams promptly, fostering a collaborative approach to issue resolution.
4. Continuous Optimization:
Regularly review and optimize your monitoring strategy. As your applications evolve, so should your monitoring and alerting mechanisms.
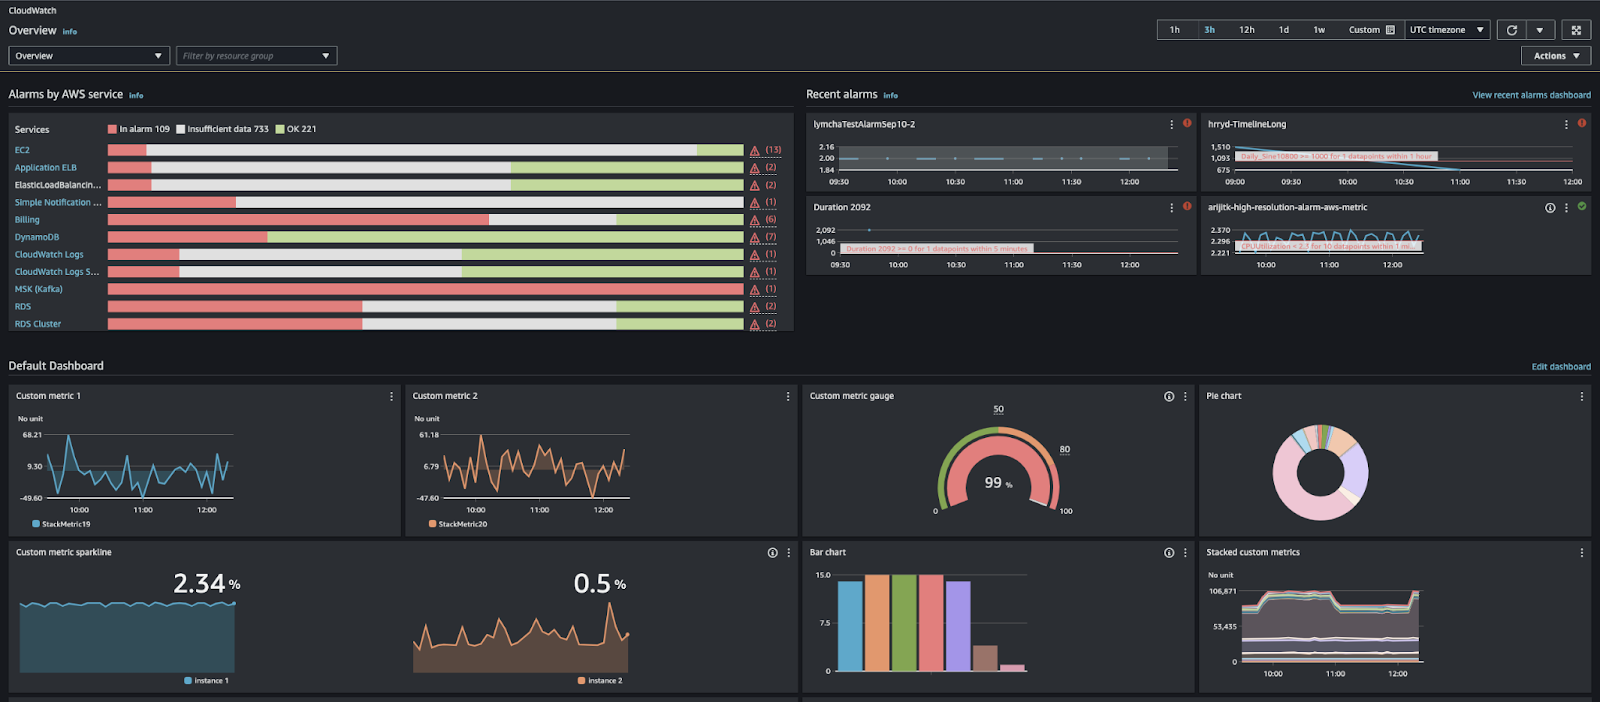
The generalised CloudWatch Dashboard looks like:
Conclusion:
In the dynamic and complex cloud environment, leveraging tools like Amazon CloudWatch for monitoring and alerting is paramount. By embracing CloudWatch's comprehensive features and adopting best practices, organizations can enhance their operational efficiency, improve response times, and ensure a seamless experience for their users. As cloud computing continues to evolve, CloudWatch remains a crucial ally for businesses striving to achieve excellence in performance, reliability, and security.
Reference Links:
https://docs.aws.amazon.com/AmazonCloudWatch/latest/monitoring/AlarmThatSendsEmail.html
https://docs.aws.amazon.com/AmazonCloudWatch/latest/monitoring/cloudwatch_concepts.html
https://docs.aws.amazon.com/AmazonCloudWatch/latest/monitoring/GettingStarted.html
Written By, Swapneel Maslekar, Cloud Engineer at Cloud.in
.png)
No comments:
Post a Comment